Exploring HR Data: A Comprehensive Analysis
Unveiling insights and trends within an organization's workforce
As organizations grow, understanding and managing human resources become paramount. In this project, we delve into a comprehensive analysis of HR data, uncovering valuable insights and trends within the workforce. By harnessing the power of data analytics and visualization, we gain a deeper understanding of the organization's dynamics and make data-driven recommendations for effective HR strategies.
Data Used
HR Data with over 22,000 rows from the year 2000 to 2020 was utilized for this analysis. The dataset encompassed various employee attributes, including gender, race/ethnicity, age, department, job title, location, employment status, and tenure.
Methodology
The project employed a three-step approach: data cleaning and analysis, data visualization, and answering key questions pertaining to the organization's workforce.
- Data Cleaning & Analysis: The HR data was processed and cleaned using MySQL and Jupyter Notebook with SQL magic. This step involved addressing missing values, removing outliers, and ensuring data integrity.
- Data Visualization: Power BI, a powerful business intelligence tool, was utilized to create interactive and insightful visualizations. These visualizations aid in presenting the HR data in a comprehensible and impactful manner.
- Key Questions: Several key questions were addressed through the analysis, including the breakdown of employees by gender and race/ethnicity, age distribution, headquarters versus remote work locations, average length of employment for terminated employees, gender distribution across departments and job titles, job title distribution, turnover rate by department, distribution of employees across locations by state, changes in employee count over time, and tenure distribution by department.
Summary of Findings
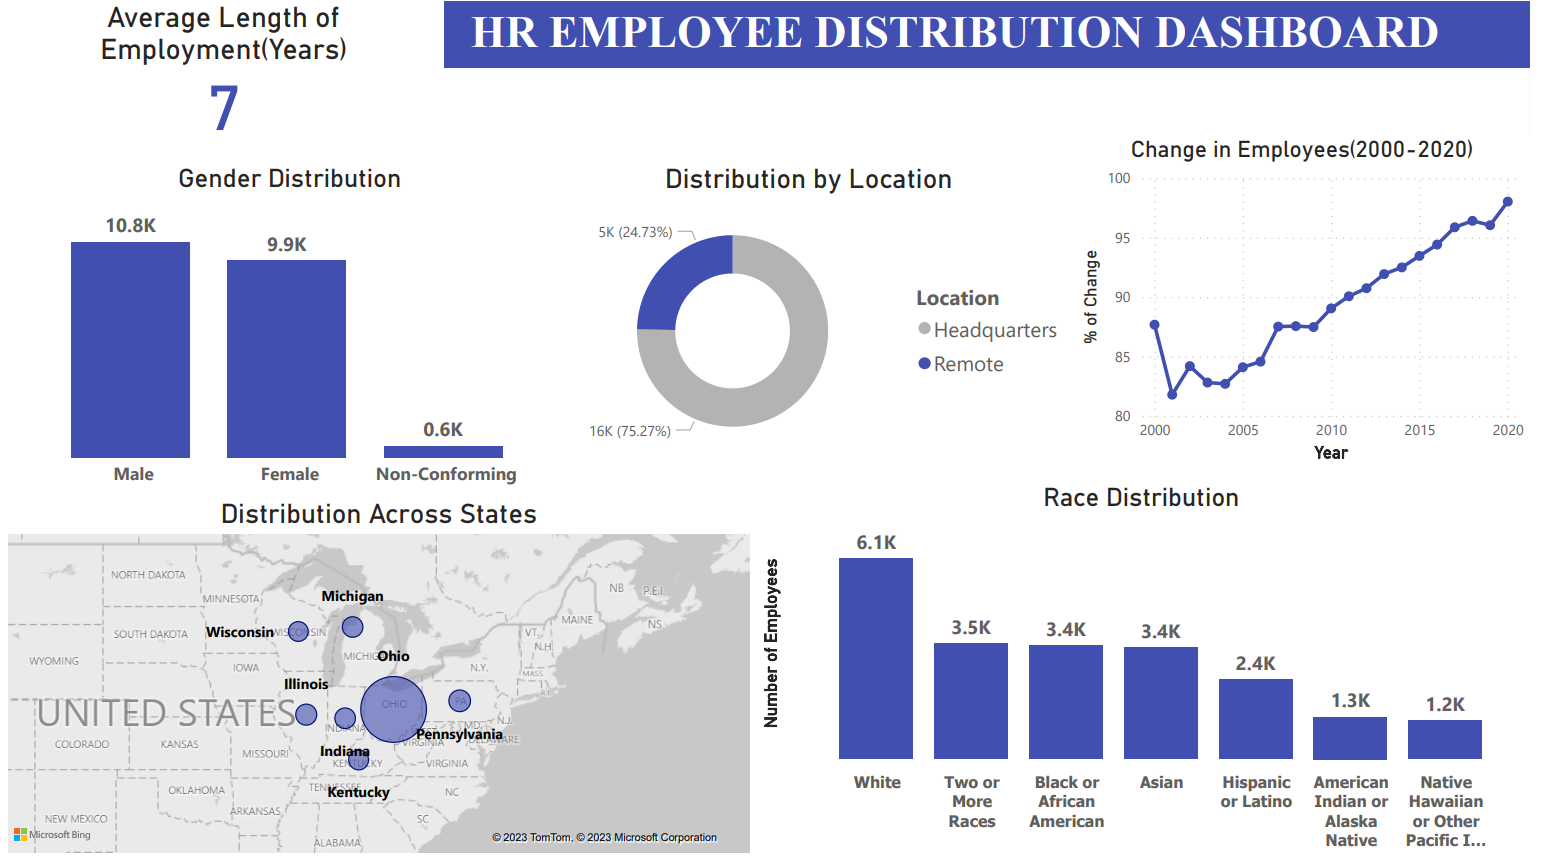
- There is a higher proportion of male employees compared to female employees within the organization.
- White employees constitute the majority, while Native Hawaiian and American Indian employees represent the smallest portion.
- The age distribution of employees ranges from 20 to 57 years, with the highest concentration between the ages of 25-34.
- A significant number of employees work at the headquarters rather than remote locations.
- The average length of employment for terminated employees is approximately 7 years.
- Gender distribution across departments and job titles is relatively balanced, with a slight skew towards male employees.
- The Marketing department exhibits the highest turnover rate, followed by Training, while Research and Development, Support, and Legal departments have the lowest turnover rates.
- A substantial number of employees are based in the state of Ohio.
- The company's employee count has shown a net increase over the years, as observed from the analysis of hire and term dates.
- The tenure distribution varies among departments, with Legal and Auditing departments having the highest average tenure, while Services, Sales, and Marketing departments have the lowest.
Limitations
- Records with negative ages were excluded from the analysis, resulting in the exclusion of 967 records. Only employees aged 18 years and above were considered.
- Term dates that were set far into the future were not included in the analysis, resulting in the exclusion of 1,599 records. Only term dates up to the current date were considered.
By unraveling the intricacies of HR data and extracting meaningful insights, organizations can make informed decisions to optimize their workforce management strategies. This project serves as a testament to the power of data-driven HR analytics, offering valuable insights into various aspects of the organization's human resources.